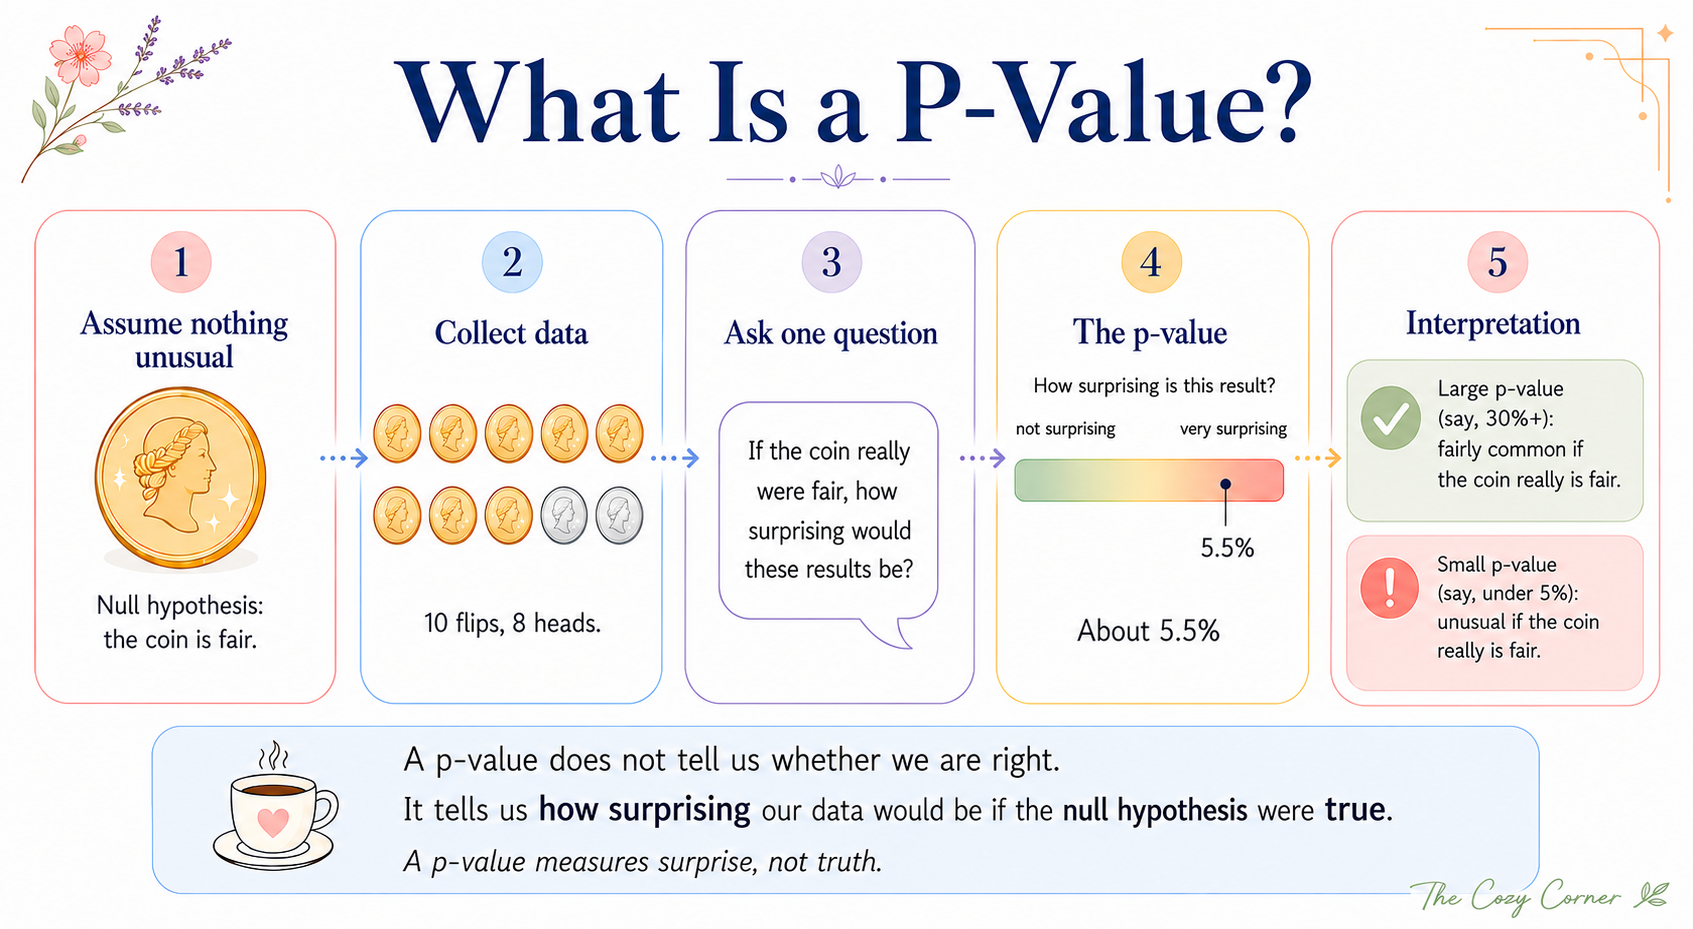
A five-step infographic explaining a p-value: assume nothing unusual, collect data, ask how surprising the result would be, calculate the p-value, then interpret it

P-Values, Explained With Coins, Chocolate, and a Little Doubt

Ever seen a headline like “Study Finds Chocolate Makes You Happier” and thought, finally, science gets something right? Congratulations, you already care about p-values. You just did not know that was the thing you were reacting to. Here is a smaller, less delicious version of the same question. You flip a coin ten times. Eight land on heads. Your friend says, immediately, “That coin must be weighted.” Another friend just shrugs. “Weird things happen sometimes.” So who is right? ...
July 13, 2026 · 10 min · The Cozy Corner 🌿
The Data Pipeline, Made Simple

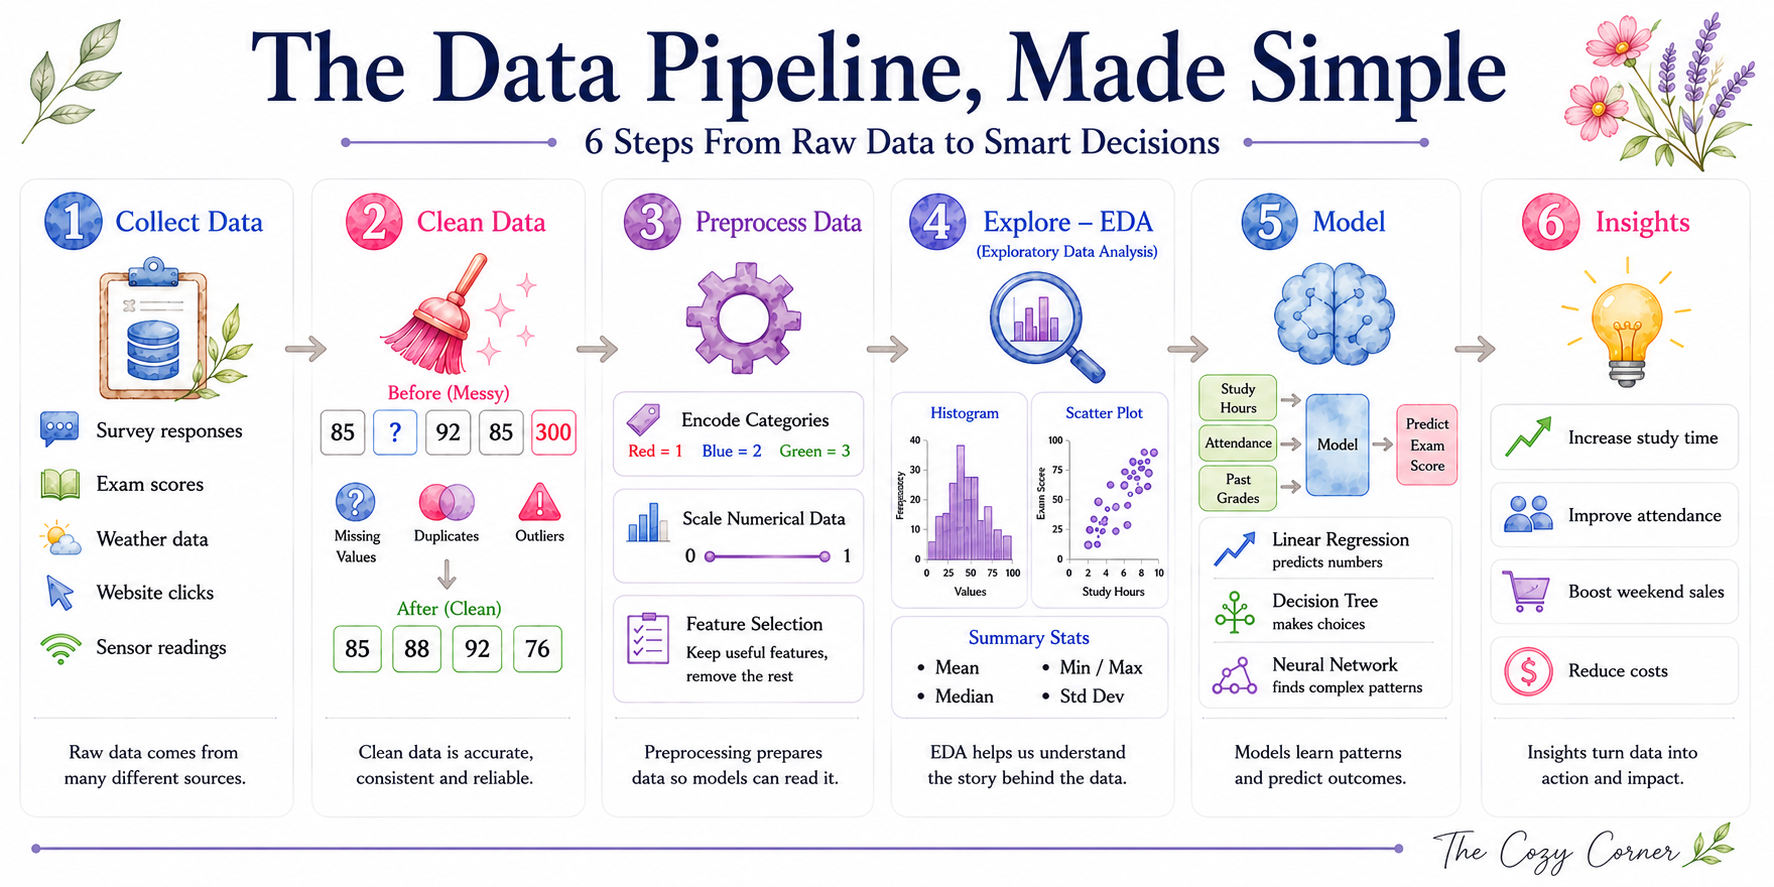
The Data Pipeline, Made Simple

Imagine You’re a School Principal It’s the end of the year. Hundreds of students have taken exams. Some did incredibly well. Others struggled. Parents want answers. Teachers want answers. And you have one important question: “What actually helps students achieve better results?” The answer is hidden somewhere inside the data. But there’s a problem - the data is a mess. Missing scores, duplicate records, obvious mistakes. Right now, all you have is a giant spreadsheet that looks more confusing than helpful. ...

June 22, 2026 · 5 min · The Cozy Corner 🌿