Ever seen a headline like “Study Finds Chocolate Makes You Happier” and thought, finally, science gets something right? Congratulations, you already care about p-values. You just did not know that was the thing you were reacting to.
Here is a smaller, less delicious version of the same question.
You flip a coin ten times. Eight land on heads. Your friend says, immediately, “That coin must be weighted.” Another friend just shrugs. “Weird things happen sometimes.” So who is right?
Statistics, oddly enough, refuses to answer that question head on. Instead it asks a sideways one:
“If the coin really were fair, how surprising would this result be?”
That question, once you sit with it, turns out to be one of the most famous ideas in statistics, and one of the most misunderstood. It is called the p-value.
Hang onto that coin. Actually, if there is one within reach, grab it and flip it ten times right now. Count the heads and keep that number somewhere in your head. You will want it in a few minutes. No coin nearby? Do not worry about it. There is a virtual one right below, so give it a flip and keep your result in mind.
Try it yourself. Flip a fair coin ten times and watch the p-value update.
Flip the coin to see how surprising your result would be.
Before We Continue
Before we go any further, humour us with a quick prediction. Assume the coin is perfectly ordinary, no trickery, fifty-fifty odds each flip. If it gets flipped ten times, how often would you guess it lands on eight or more heads?
- Almost never
- About 1 in 20 times
- About 1 in 5 times
Do not overthink it. Just pick one. And while you are at it, hold your guess up against the coin you actually flipped a minute ago. Did your result feel shocking, or kind of unremarkable?
Starting With a Skeptical Assumption
Underneath almost every statistical test sits a quiet, slightly stubborn assumption: nothing unusual is happening here.
Statisticians call it the null hypothesis. The coin is fair. The new website design has not changed anything. The new medicine works no better than the old one. It is the default, boring story, and the whole point of a test is to see whether the evidence gives us a reason to abandon it.
Think of a courtroom, minus the dramatic gavel-banging. A defendant starts out presumed innocent. Statistics starts out presuming nothing interesting is going on, and only budges when the evidence gets loud enough to demand attention. That is really all the p-value is for. It measures how loud the evidence is.
A Measure of Surprise
If this whole article boils down to one sentence, it is this:
A p-value is a measure of surprise.
That is really it. It asks:
“If nothing unusual were happening, how surprising would these results be?”
Imagine surprise as a sliding scale.
Five heads feels pretty normal. Six still is not unusual. Seven starts to get interesting. Eight, and you are paying attention. Ten, and something strange might be going on.
A p-value simply turns that feeling into a number.
Now for the slightly more formal version. A p-value is the probability of seeing a result as extreme as yours, or more extreme, assuming the null hypothesis is true. “As extreme” sounds like jargon, but it simply means at least as unusual as what actually happened. If you got eight heads and you are wondering whether the coin favors heads, you would also count anything even more lopsided, like nine heads, or all ten.
Imagine listing every possible outcome of ten fair coin flips. Most of those outcomes contain something close to five heads. Only a small handful end up as unusually one-sided as eight, nine, or ten heads.
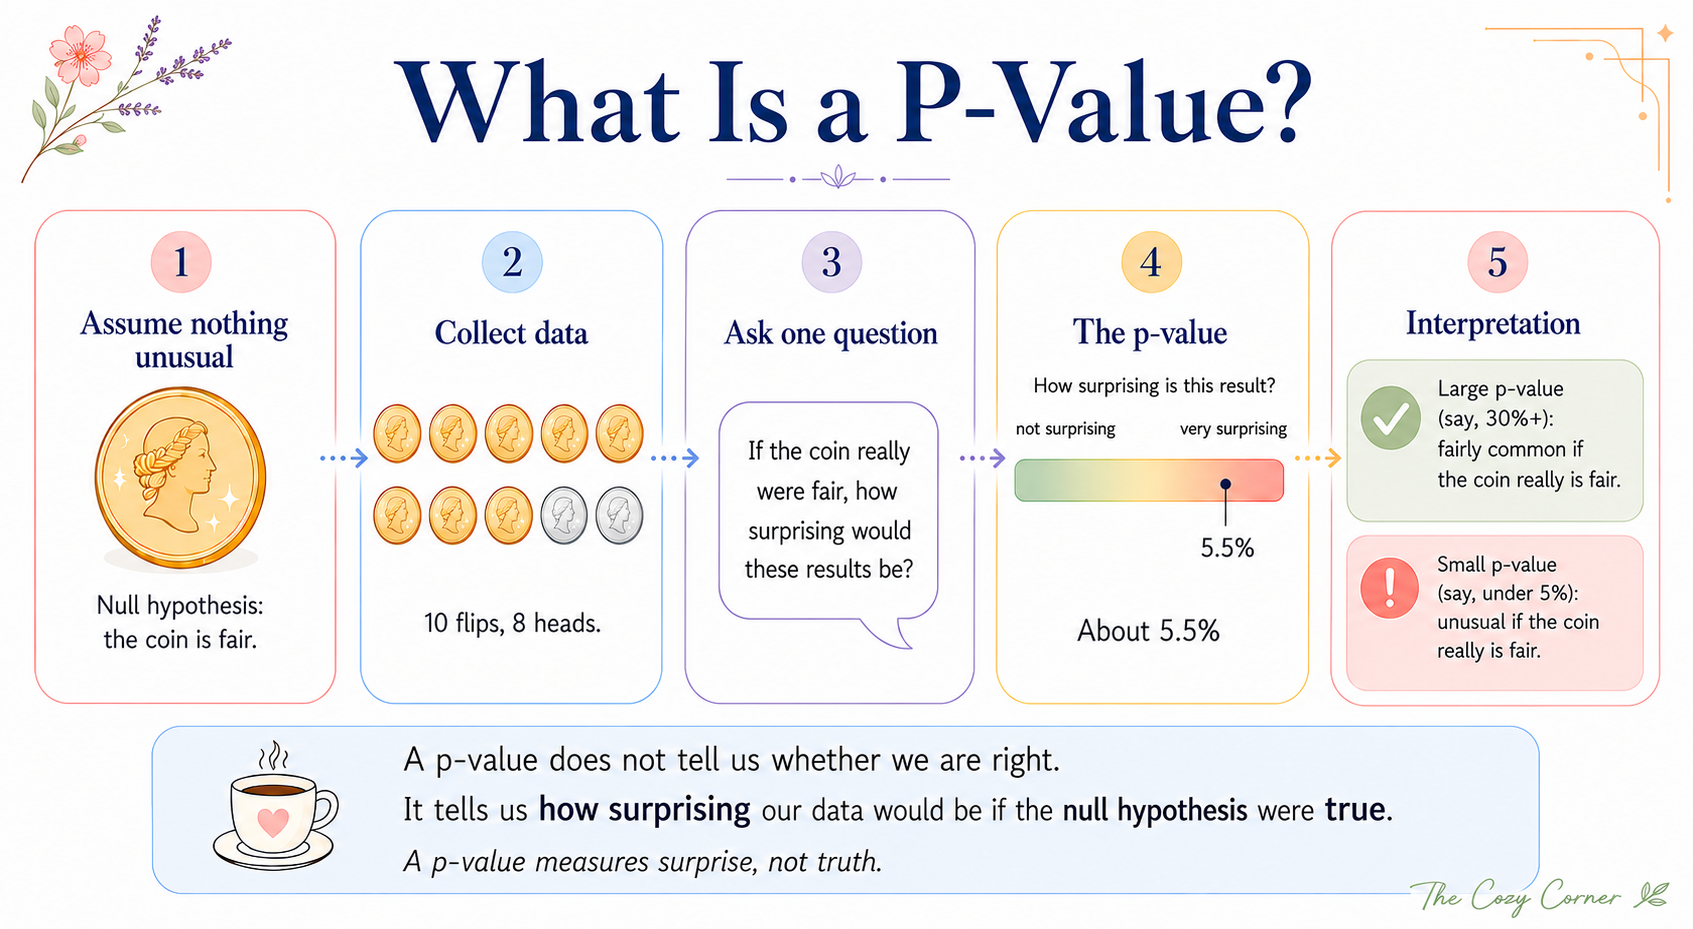
Those rare outcomes together make up about 5.5 percent of all possibilities. That number, 0.055, is the p-value.
A small p-value is a reason to question the boring assumption, not proof that it is wrong. It is an invitation to investigate further, not a certificate that your hypothesis is correct. A large p-value, on the other hand, means your result is the kind of thing chance produces fairly often, so there is little reason to doubt anything.
Here is where most people trip, so slow down for a second. A p-value does not tell you the probability that the coin is fair. It does not tell you the probability that your hypothesis is right. All it tells you is how surprising your data would look if the boring assumption were true.
Small distinction on paper. Huge in practice. This one misunderstanding has confused students, journalists, and even experienced researchers for decades, so do not worry if it takes a second read.
🌿 One Small Shift in Thinking
Most people expect a p-value to answer, “Is my hypothesis true?” It is not answering that. It is answering something closer to, “If the null hypothesis were true, would data this unusual still be reasonably expected?”
Keep that distinction somewhere in the back of your mind. We are coming back to it before we are done, because it is the kind of thing that is easy to nod along to now and quietly forget by the end.
Where Does 0.05 Come From?
Quick one before we get into it. If you were building a smoke detector, how twitchy would you make it? Sensitive enough to catch every real fire, even if that means the occasional false alarm over burnt toast? Or the other way around?
Researchers wrestle with the same trade-off, and most pick a threshold before they even collect data. The usual number is 0.05. Cross below it, and the result earns the label statistically significant.
Do not mistake 0.05 for some deep truth of the universe. It is not carved into the mathematics anywhere. It is a convention, one that stuck around because it tends to strike a workable balance between being too suspicious and too easily convinced. Some fields tighten that number to 0.01 or even 0.001, especially where a wrong call carries real consequences, like approving a new medicine.
And here is a catch worth remembering: statistically significant does not mean important. Collect enough data and even a tiny, practically irrelevant effect can slip under 0.05. A drug that helps one person in ten thousand can still land a p-value of 0.001. That is not the same thing as a drug worth taking. Which is exactly why researchers also look at how big the effect actually is, how well the study was designed, and whether anyone else can reproduce it.
When Statistics Gets It Wrong
So far this all sounds tidy. Collect data, run the number, make the call. Real life is messier.
Sometimes the boring assumption is actually true, and random chance still hands you a strange-looking result. You get fooled into thinking something is going on when it is not. That is a false positive. A bit like crediting your new fertilizer for a thriving houseplant, when really it just liked being closer to the window.
Other times something genuine really is happening, but the evidence is too thin to catch it. Maybe the sample was too small, or the effect too subtle. That is a false negative, the statistical version of a good idea that never got a fair shot to prove itself.
Neither one means the whole system is broken. They are just the cost of dealing with uncertainty, and if we are honest, a little uncertainty is what keeps any of this interesting. Every statistical call carries some risk of being wrong, and any decent scientist keeps that in the back of their mind rather than pretending otherwise.
Why Data Scientists Care
Picture this. You work at Spotify. The design team tweaks the Play button, maybe rounds the corners, maybe picks a slightly more satisfying green, and a week later people seem to be clicking it more.
Great news. Someone brings snacks. Or, was it just noise, and the snacks were premature?
This exact question shows up constantly in data science. Companies A/B test website designs, roll out app features, run marketing campaigns, and pick apart user behaviour, all trying to answer one thing: is this difference real, or did random chance produce it?
It works as a guardrail against fooling ourselves. Random data throws up patterns that look meaningful all the time, the same way clouds occasionally look like faces. A p-value forces a pause before we hand every interesting-looking blip a whole backstory.
Still, it is one tool among several. A good call also weighs how big the effect is, how solid the study was, what we already know, and whether anyone else finds the same thing.
Worth keeping in your back pocket: next time someone tells you a study was “statistically significant,” ask them, calmly, significant for what, exactly? That one question puts you ahead of most people reading the same headline.
Coming Back to the Coin
So. Was your coin actually weighted? Not necessarily.
A p-value of about 0.055 would make plenty of researchers raise an eyebrow. The result is unusual enough to spark some healthy skepticism, but not unusual enough to confidently declare the coin is weighted.
Go back to the flips you did earlier. Whatever number you landed on, ask the real question now. Did it feel suspicious, or did it feel like nothing much? That gut reaction is basically the same instinct a p-value is trying to put a number on.
Now imagine flipping that same coin ten more times and getting five heads. Would you shrug and call the coin fair again, just like that? Probably not. You would fold both rounds of evidence together and let your confidence shift a little, rather than resetting to zero.
That is more or less how science tends to move. Rarely does one experiment settle anything for good. Evidence piles up, and each new piece nudges the picture a bit closer to whatever is actually true.
Here is the whole idea in one picture, in case it helps to see the five steps laid out together.

🌿 One Thing to Remember
If there is only one idea you carry away from this article, let it be this:
A p-value cannot tell you whether you are right. It can only tell you how surprising your data would be if the null hypothesis were true.
That is why scientists rarely rely on a p-value alone.
A tiny p-value does not automatically mean a result is important. It does not tell us how big the effect is. It does not tell us whether the study was well designed. It does not tell us whether someone else would find the same result tomorrow.
It is one piece of evidence, not the whole picture.
Next time, we will come back to that chocolate headline from the beginning and ask the question a p-value cannot answer by itself: even if the effect is real, does it actually matter?
Maybe chocolate really does make people a little happier, with a p-value small enough to catch a researcher’s attention. But if the improvement is tiny, so small that you would never notice it in everyday life, is it really meaningful? That is where effect size comes in, and it might completely change how you read headlines claiming something is “statistically significant.”
Until then, hang onto that coin. You have just learned one of the most misunderstood ideas in statistics, and hopefully discovered that it is much less mysterious than people often make it sound.
Maybe celebrate with a square of chocolate. Whatever the p-value has to say about it.
Quick Check
🌿 Quick Check: Did It Stick?
Five short questions on the ideas from this post.
The Cozy Corner 🌿