“Can I actually afford to live in Auckland?”
It’s a question that often comes up when people receive a job offer, plan a move from another part of New Zealand, consider relocating from overseas, or simply want a general idea of what living in Auckland might cost.
Of course, there’s no single answer. Lifestyle, spending habits, family circumstances, savings goals, and many other personal factors all play a part. Rather than trying to predict anyone’s exact budget, this project brings together publicly available New Zealand data to provide a general affordability estimate and a useful starting point.
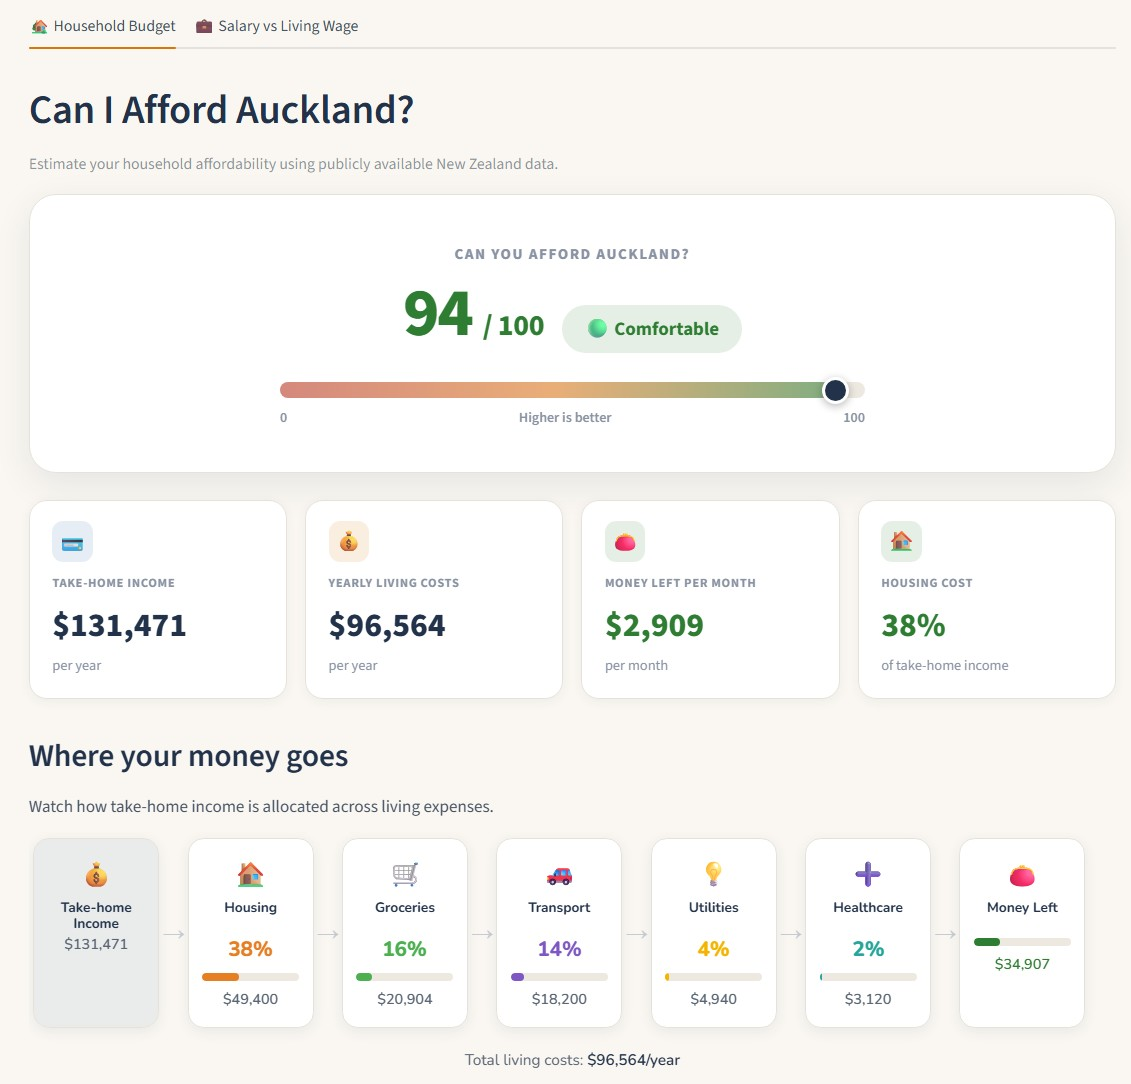
This started as a weekend side project and was built in spare time as part of my portfolio. It combines data from multiple public sources, processes it through a simple calculation pipeline, and presents the results in an interactive dashboard.
While every effort has been made to use reliable data from official New Zealand sources, the application is intended for educational and portfolio purposes only. The results are estimates and should not be considered financial advice.
The idea
Most of the information already exists publicly.
- IRD provides tax brackets.
- MBIE publishes market rental data.
- Stats NZ provides household spending statistics.
- Living Wage Aotearoa publishes the current Living Wage.
The interesting part wasn’t collecting the data. It was bringing information from different sources into one consistent workflow.

Under the hood
The project intentionally keeps things simple.
- Python and Streamlit power the application.
- CSV files store tax rates, rent data, and spending benchmarks.
- Plotly handles the visualisations.
- A lightweight calculation engine combines PAYE tax, ACC, KiwiSaver, student loans, housing costs, and everyday expenses.
Keeping the data separate from the code makes the application easier to maintain. When tax brackets or rental data change, updating the app is usually as simple as replacing a CSV file.
The calculations follow a straightforward flow:
Gross income
      ↓
PAYE tax
      ↓
ACC levy
      ↓
KiwiSaver
      ↓
Student loan
      ↓
Take-home pay
      ↓
Housing + living costs
      ↓
Estimated money left
Household expenses are adjusted using a standard equivalence scale so the estimates better reflect different household sizes.
Try it yourself
Every dataset used by the application is labelled as either REAL or ESTIMATED, making it easy to see which figures come directly from official sources and which are reasonable approximations.
Like any side project, there’s still plenty that could be improved. Adding more rental coverage, supporting additional regions, and automating future data updates are all ideas for later versions.
If nothing else, this project was a fun way to explore how publicly available data can be transformed into something interactive and practical.